Introducing explainerdashboard
quickly deploying explainable AI dashboards
As data scientists working in a public or regulated sector we are under increasing pressure to make sure that our machine learning models are transparent, explainable and fair. With the advent of tools such as SHAP and LIME, the old black-box trope actually does not really apply anymore, and it has become quite straightforward to explain how each feature contributed to each individual prediction for example. However straightforward for a data scientist is not the same as straightforward for a manager, supervisor or regulator. And so what is needed is a tool that allows non-technical stakeholders to inspect the workings, performance and predictions of a machine learning model without needing to learn Python or getting the hang of Jupyter notebooks.
With the explainerdashboard python package, building, deploying and sharing interactive dashboards
that allow non-technical users to explore the inner workings of a machine learning model
can be done with just two lines of code. For example to build this example hosted at titanicexplainer.herokuapp.com/classifier, you just to
need to fit a model:
from sklearn.ensemble import RandomForestClassifier
from explainerdashboard.datasets import titanic_survive

X_train, y_train, X_test, y_test = titanic_survive()
model = RandomForestClassifier().fit(X_train, y_train)
And pass it to an Explainer object:
from explainerdashboard import ClassifierExplainer

explainer = ClassifierExplainer(model, X_test, y_test)
And then you simply pass this explainer to an ExplainerDashboard and run it:
from explainerdashboard import ExplainerDashboard
ExplainerDashboard(explainer).run()
This will launch a dashboard built on top off plotly dash that will run on
http://localhost:8050 by default.
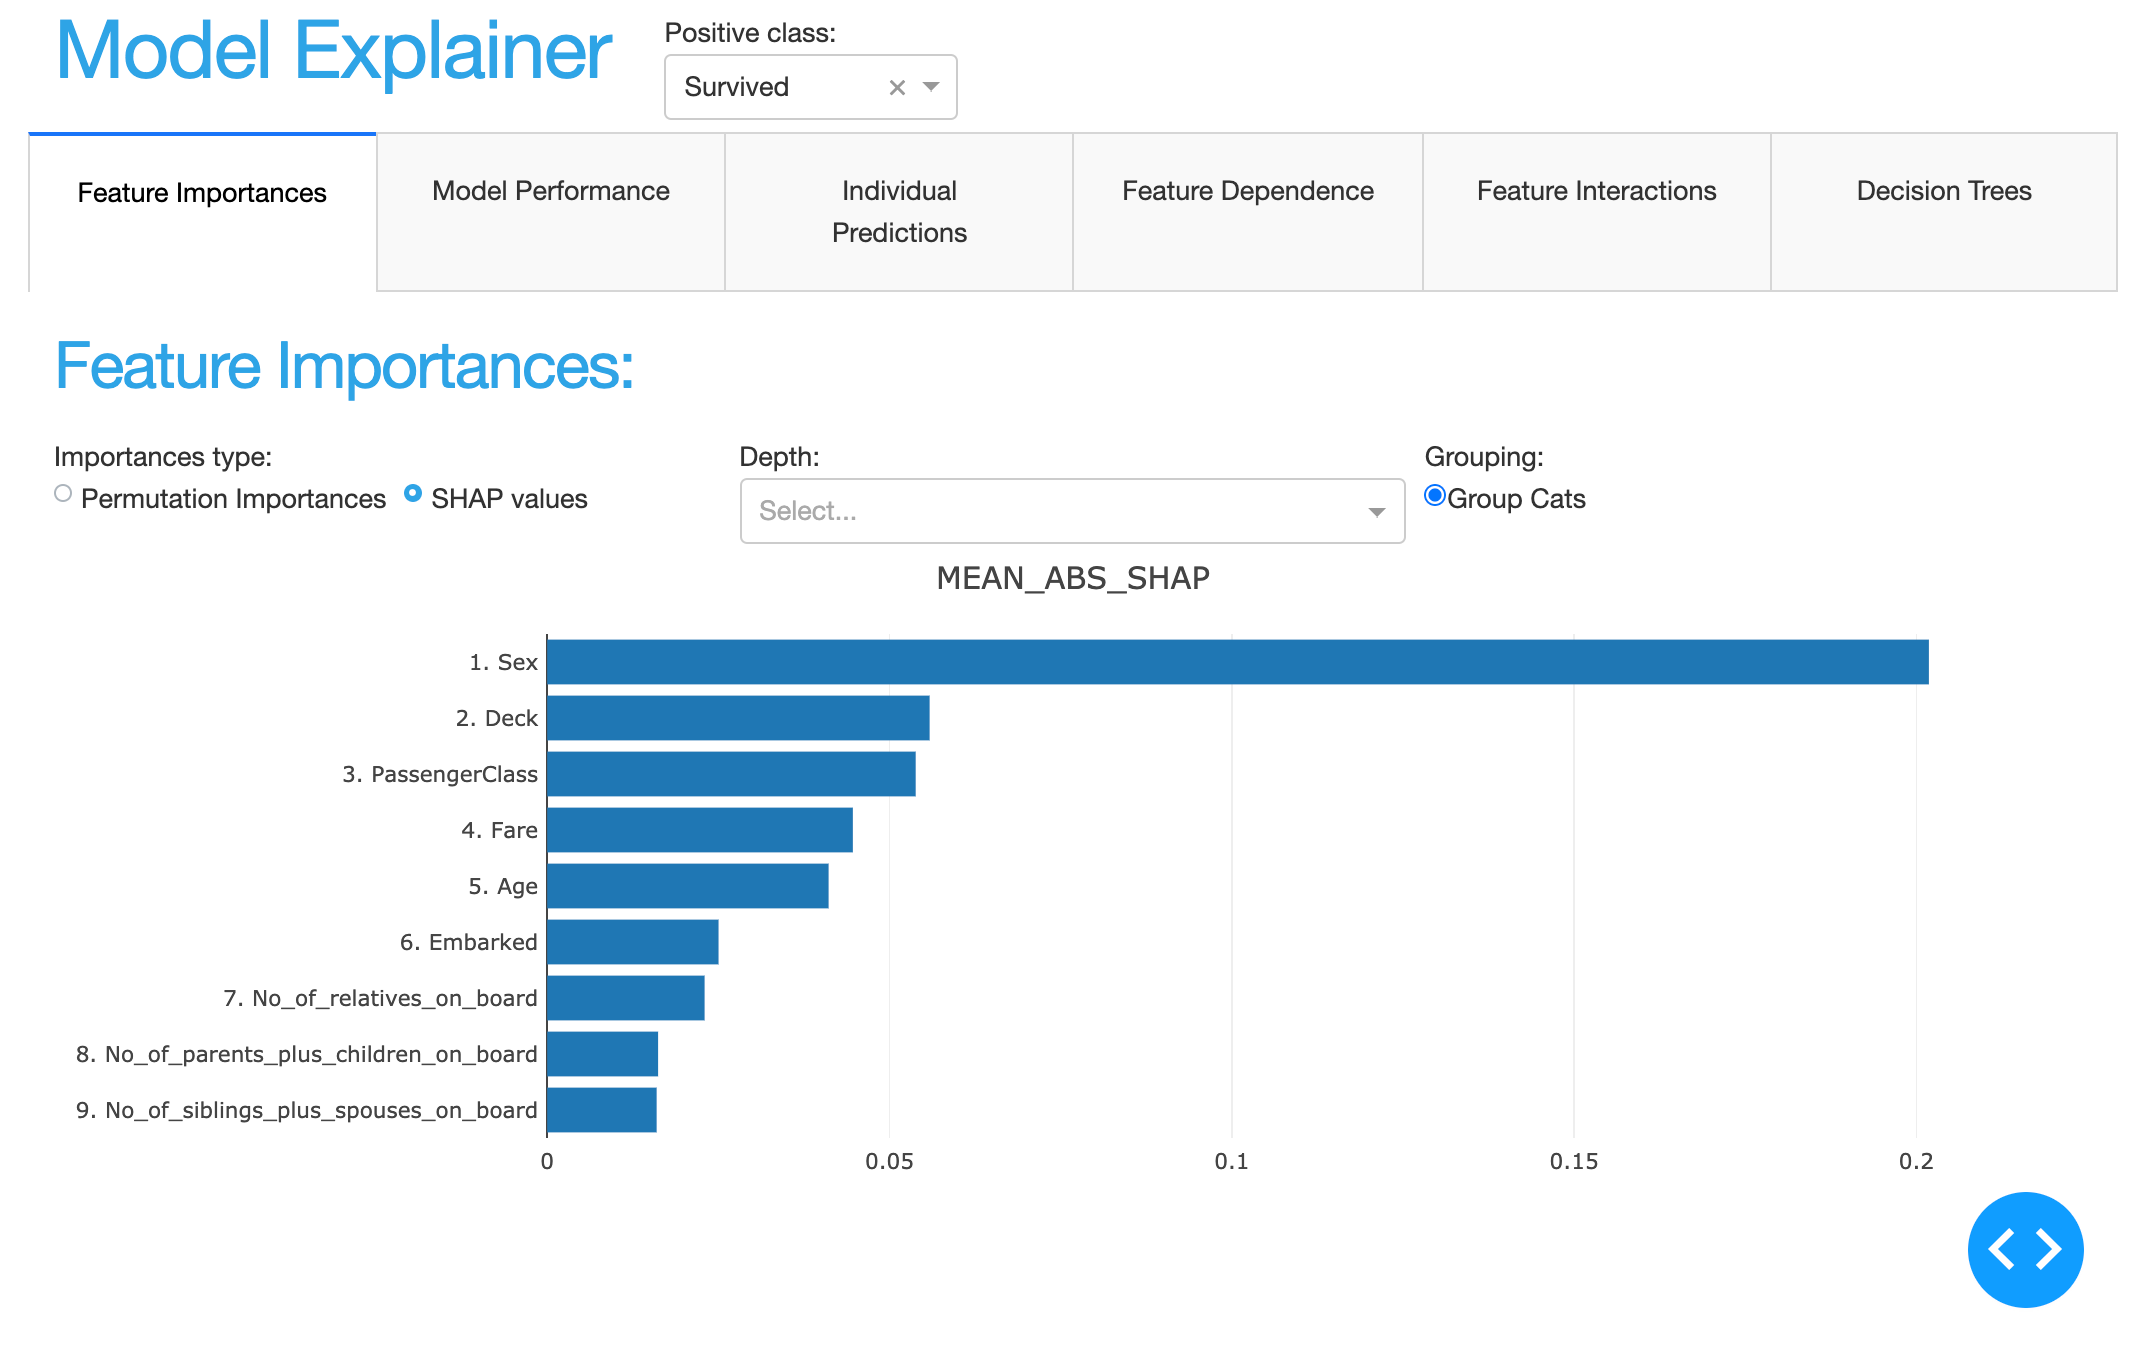
With this dashboard you can for example see which features are the most important to the model:
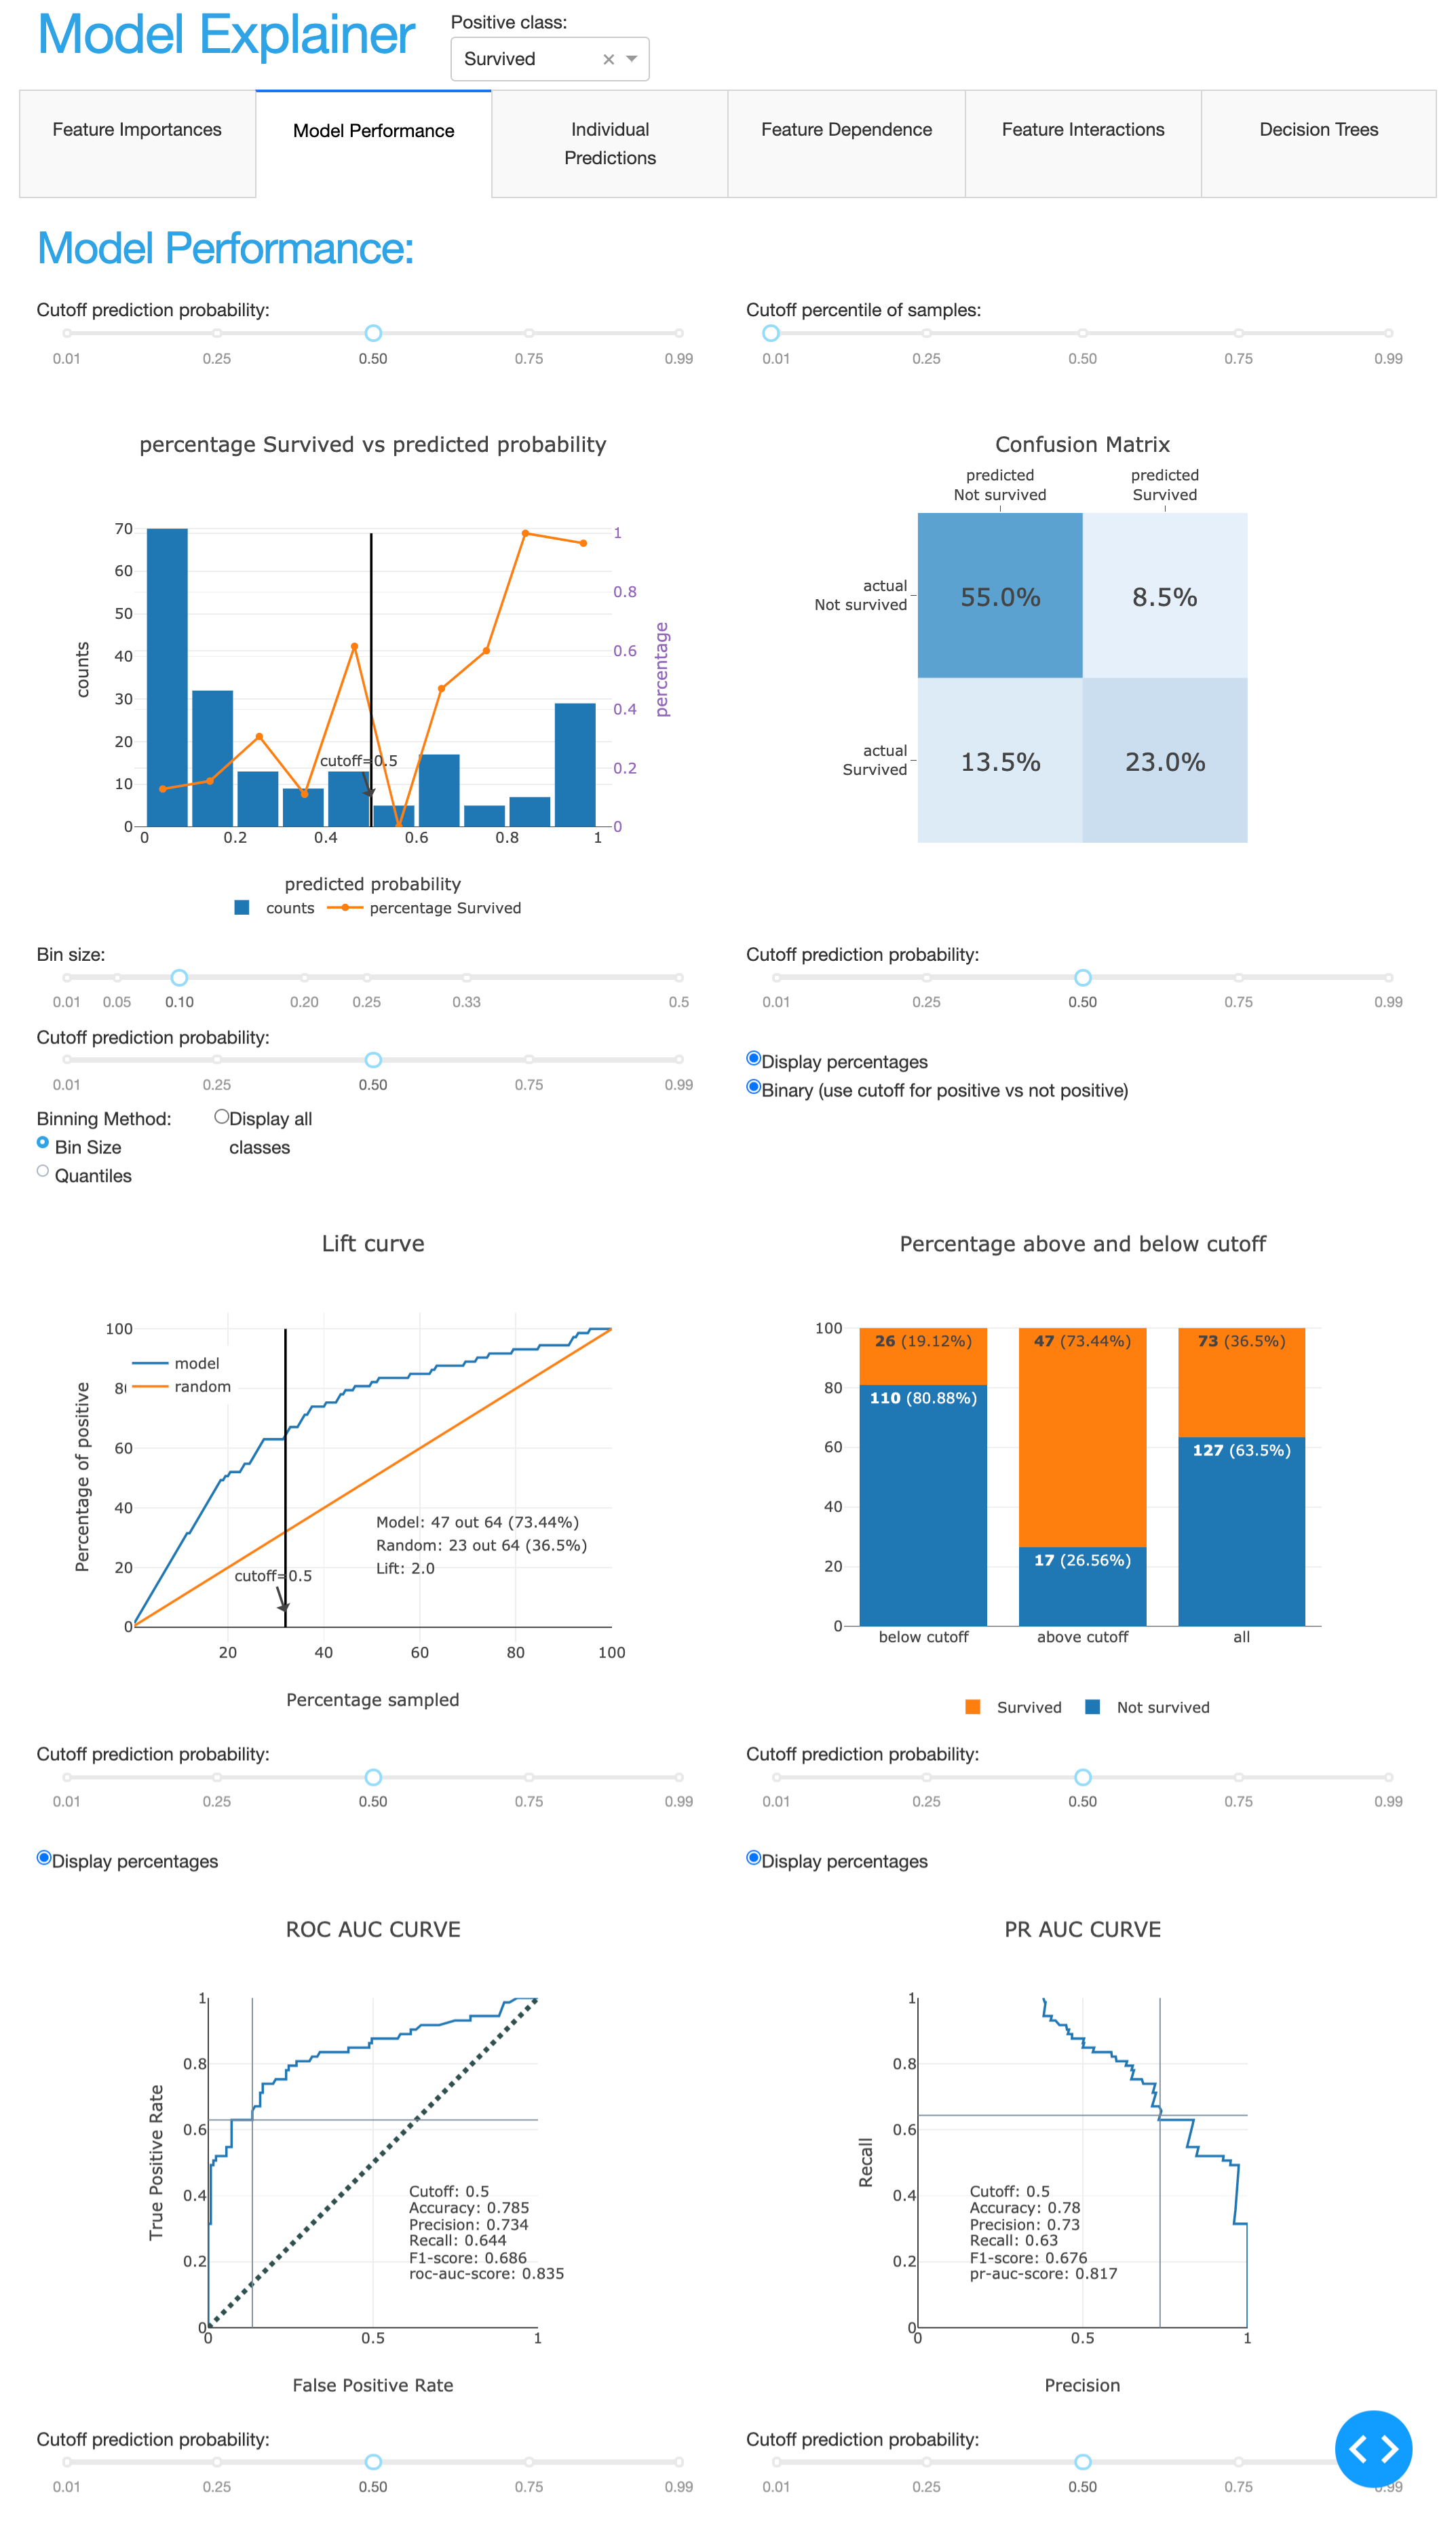
Or how the model performs:
And you can explain how each individual feature contributed to each individual prediction:
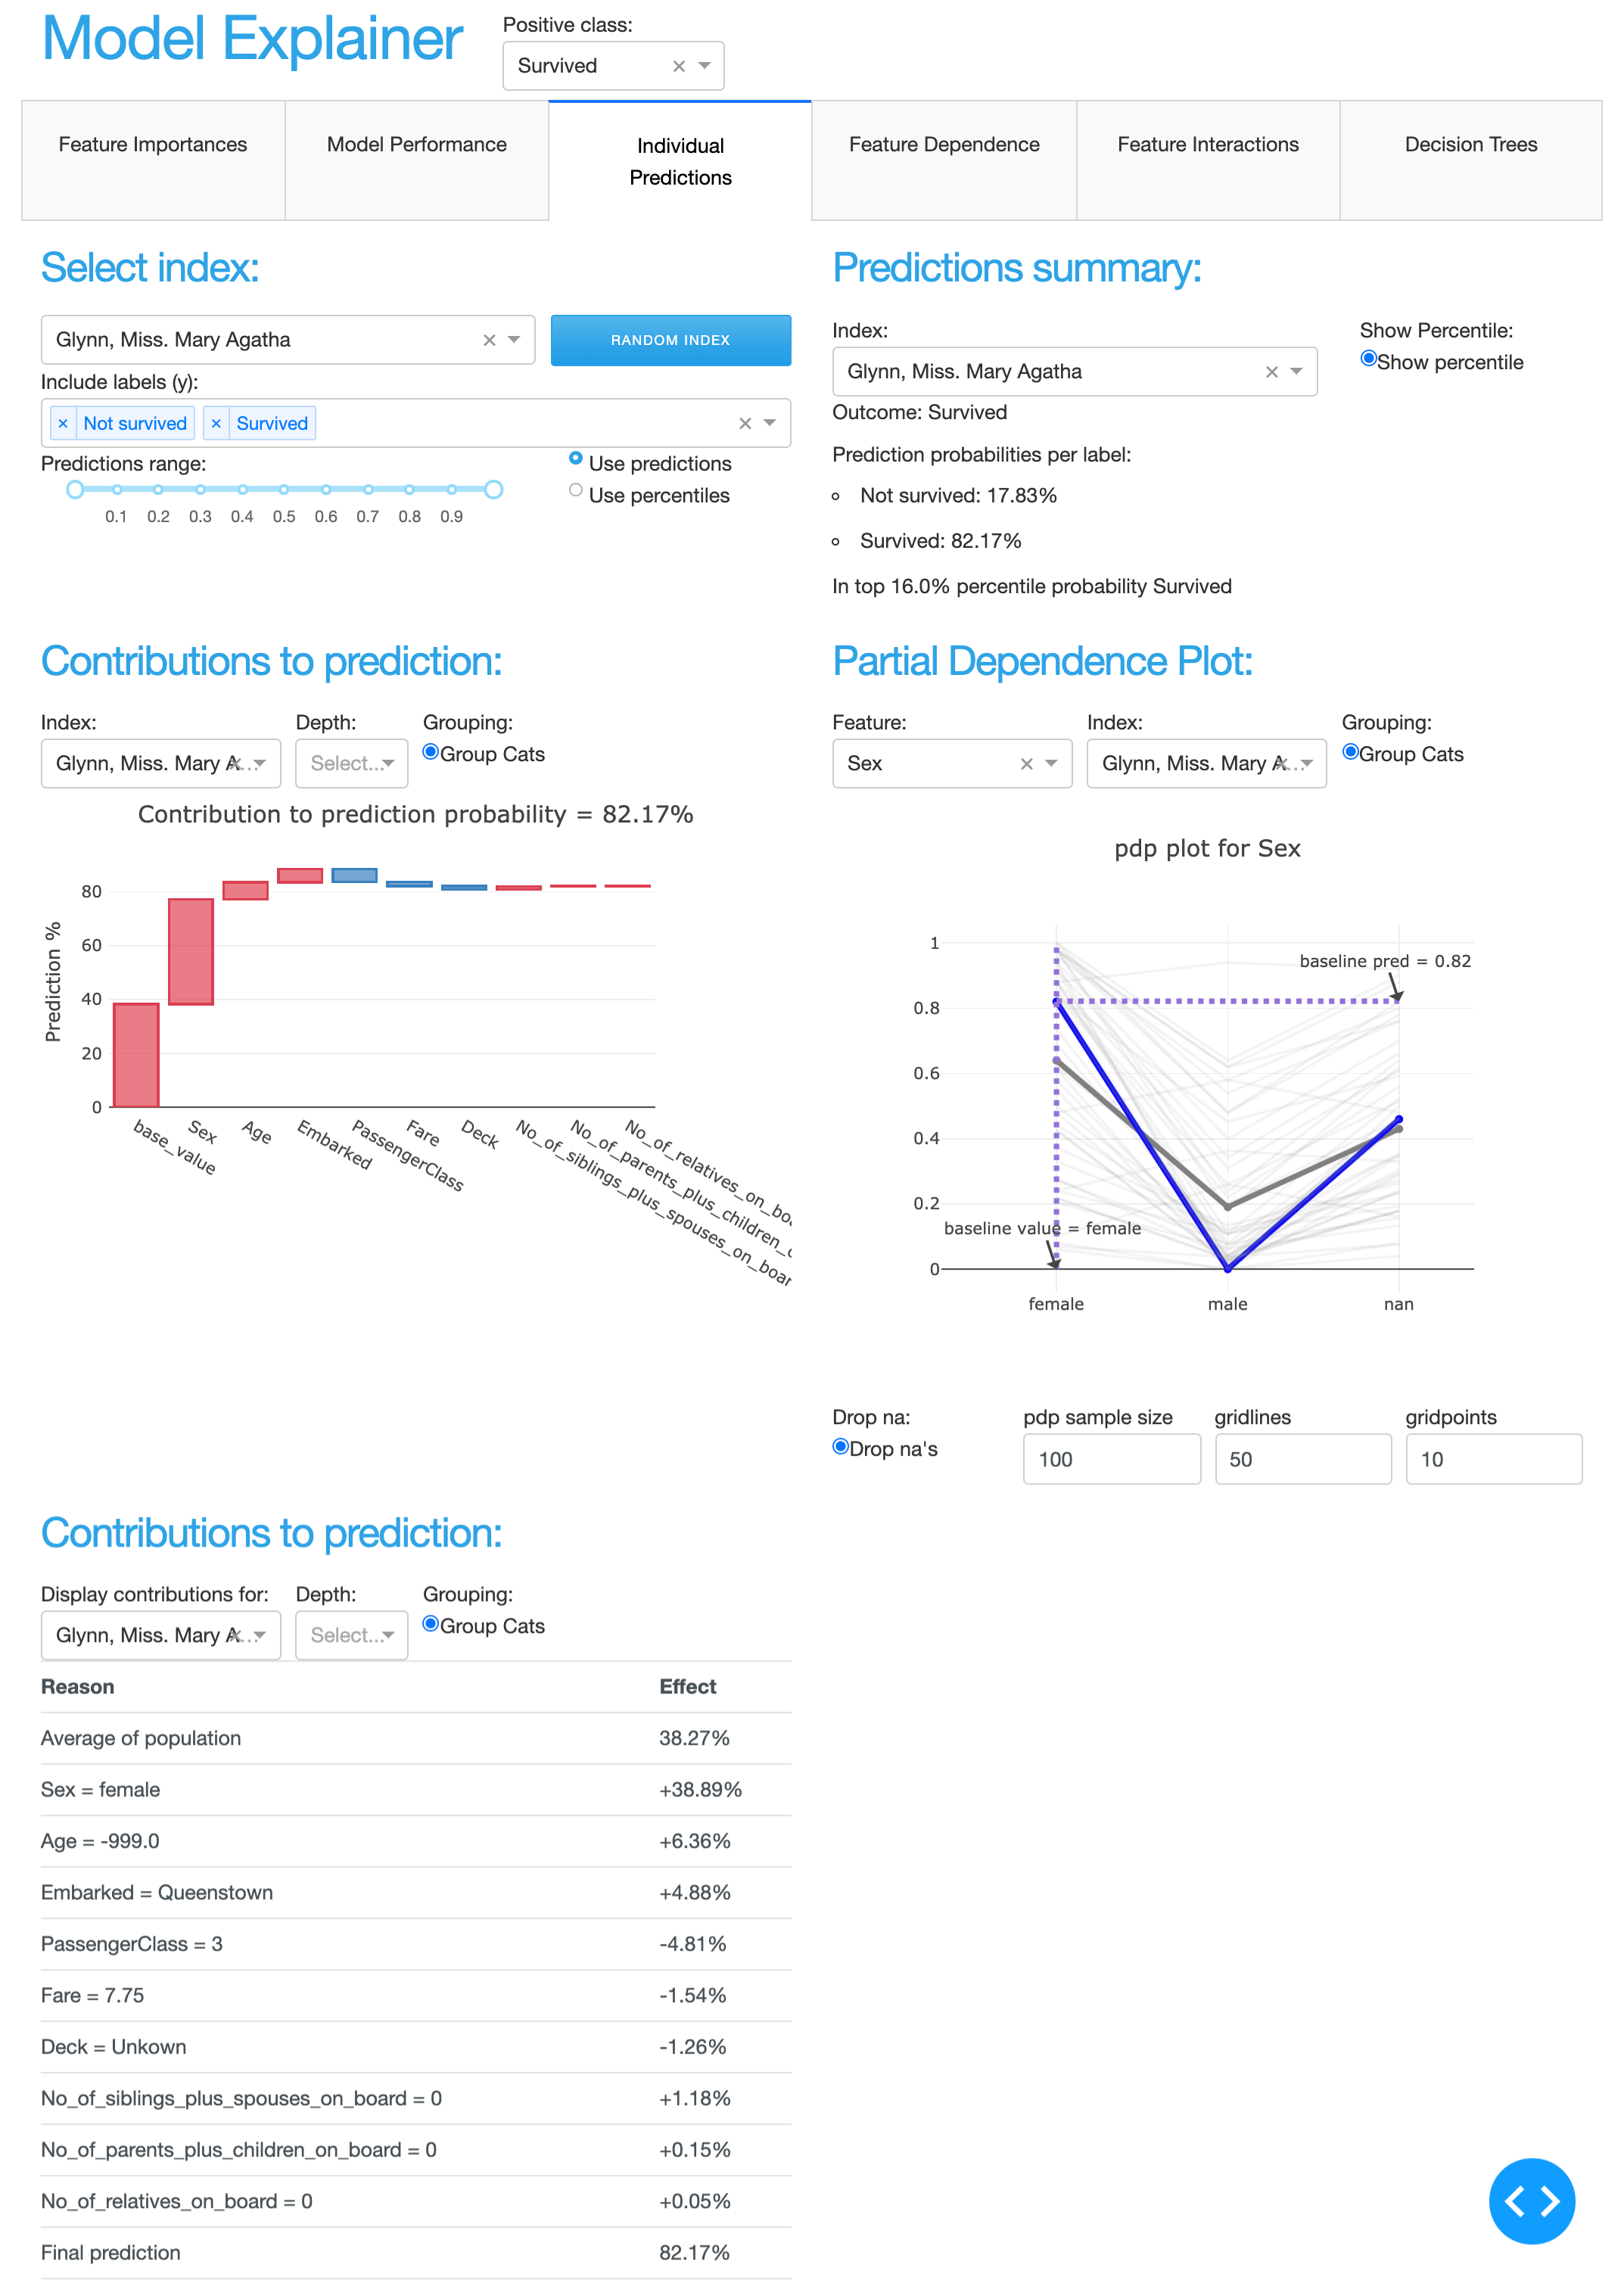
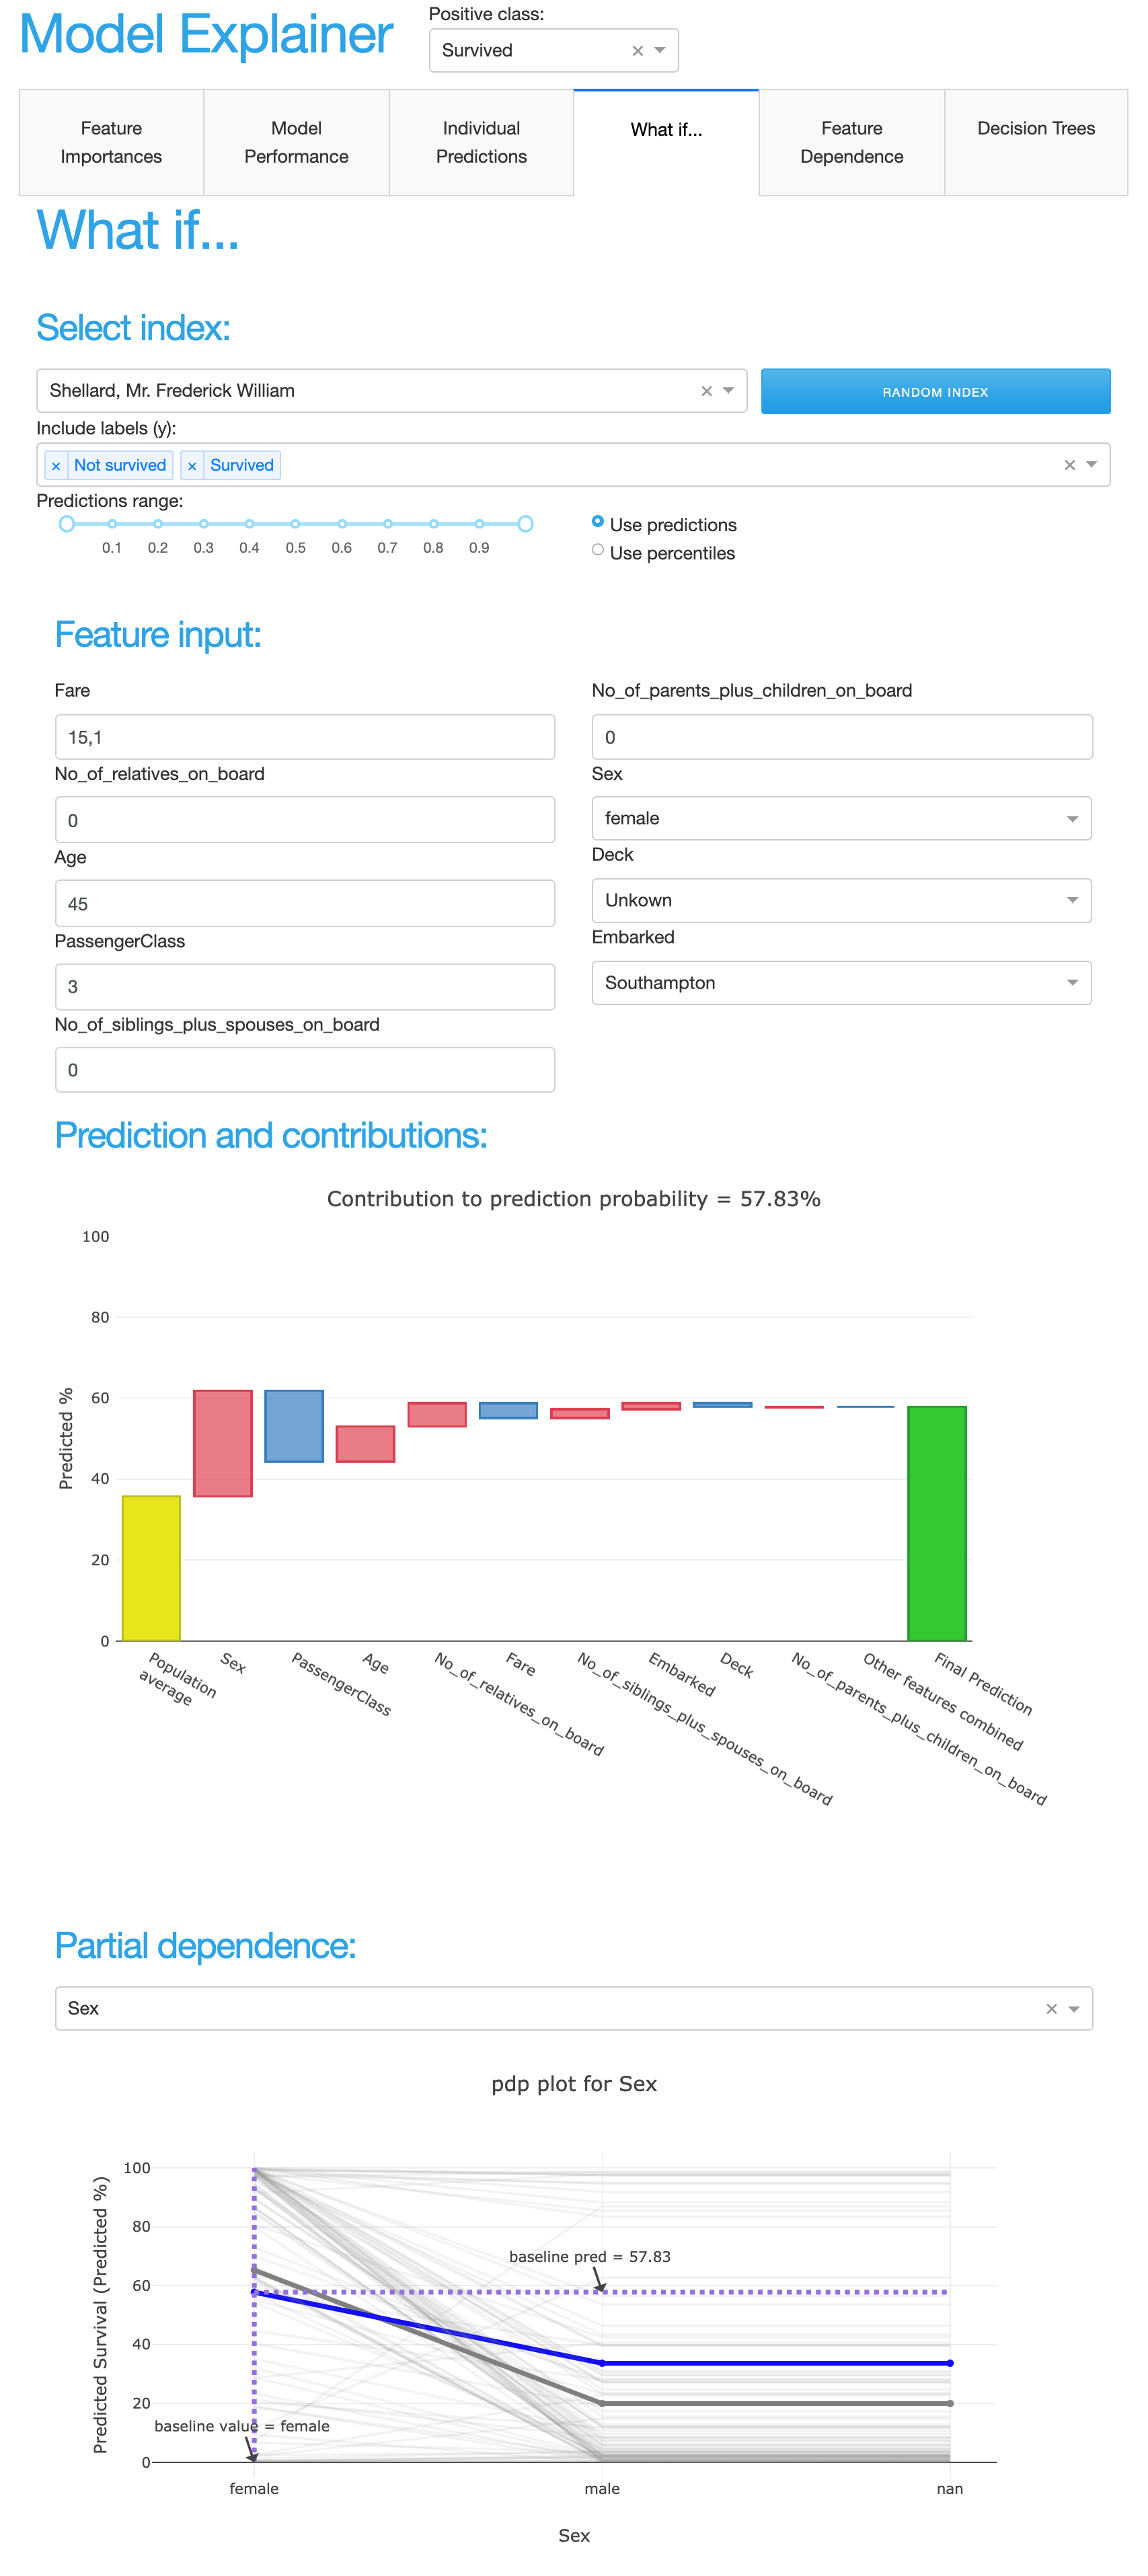
Figure out how predictions would have changed if one or more of the variables were different:
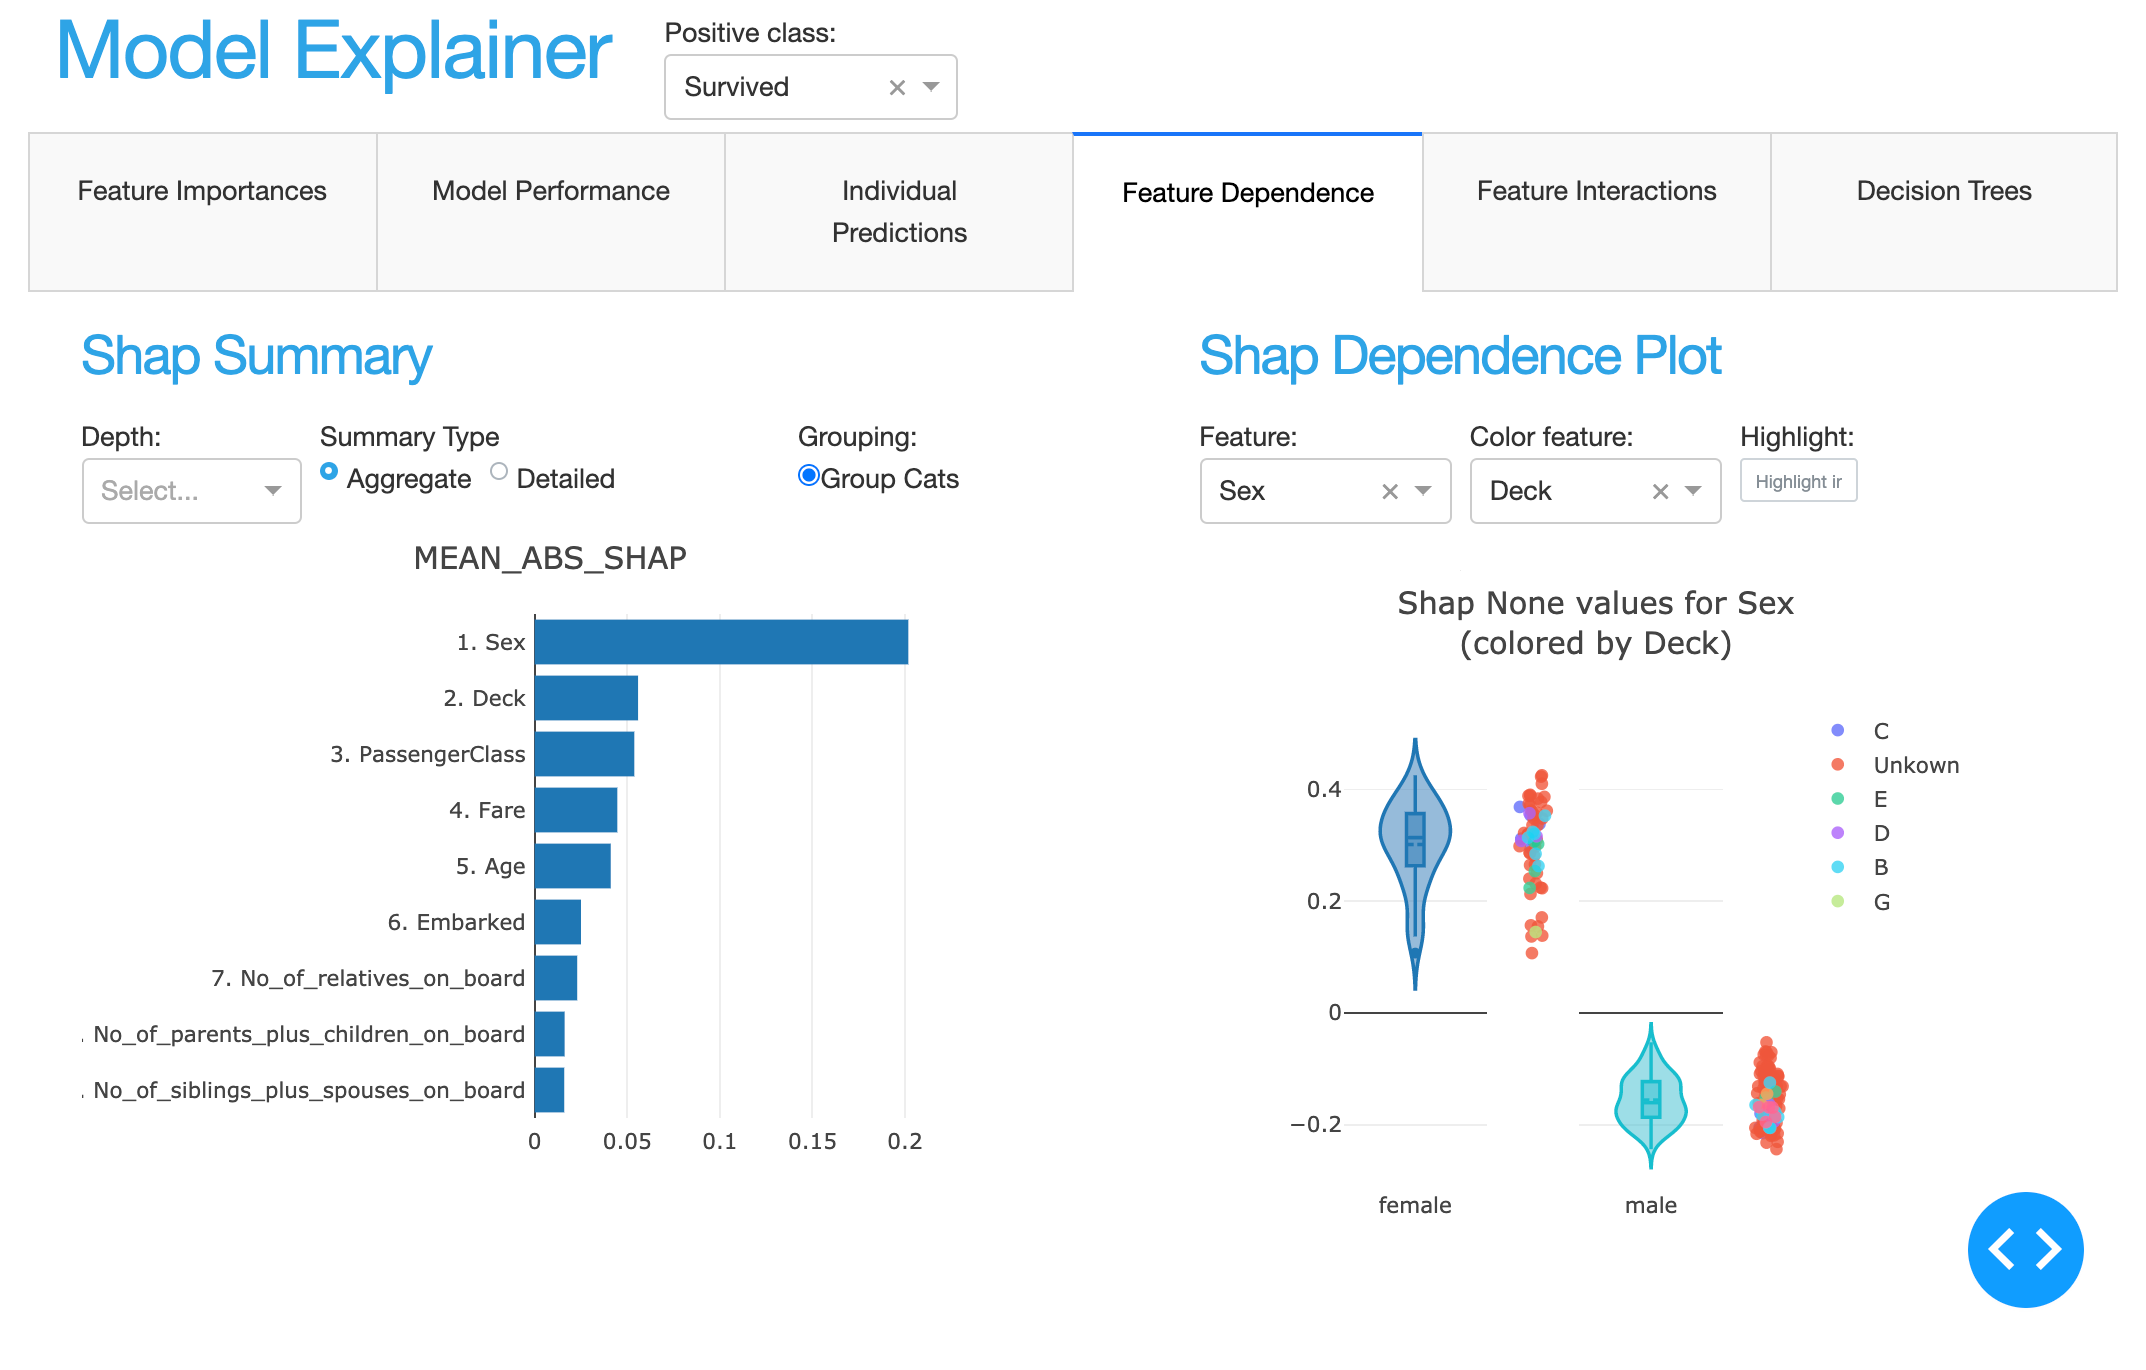
See how feature impact predictions :
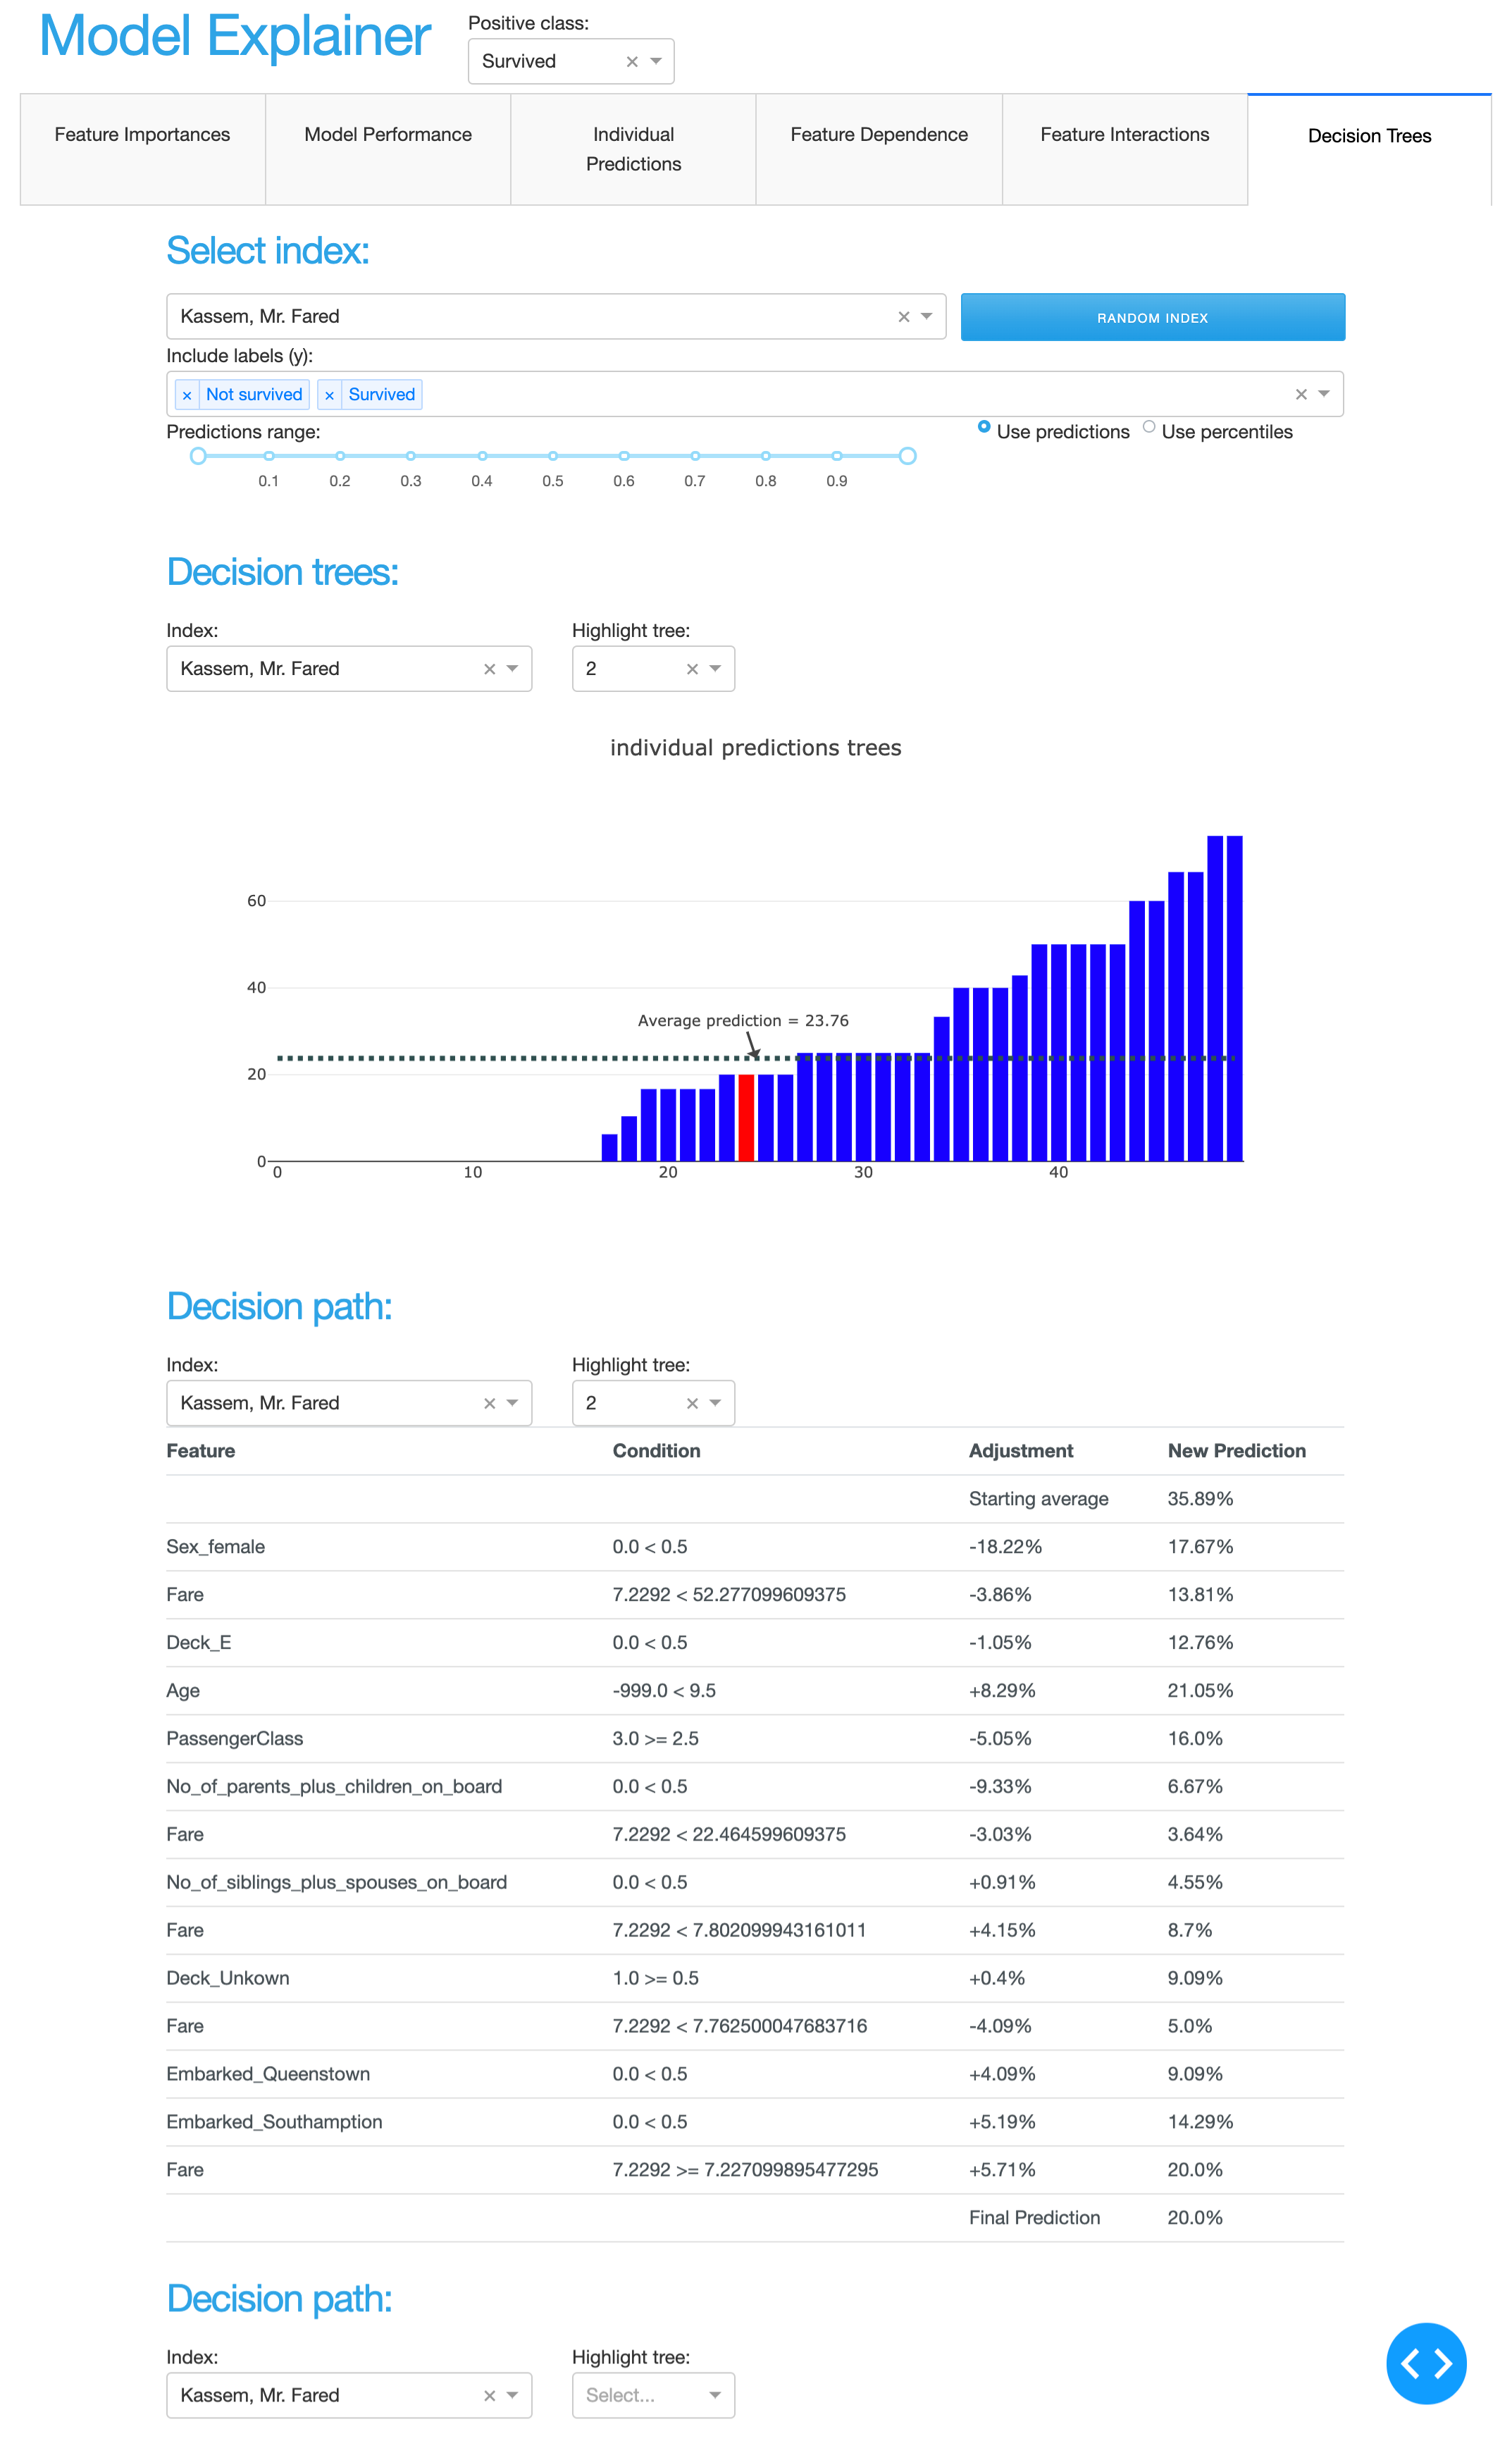
And even inspect every decision tree inside a random forest:
–>